The Hardware That Transforms Dead Space Into Revenue
Every supermarket contains thousands of square inches of wasted visual real estate. Shelf edges, freezer door frames, checkout counter faces-these spaces have held paper price tags and static promotional strips for decades. Tools from an era when retail marketing meant printing and laminating.
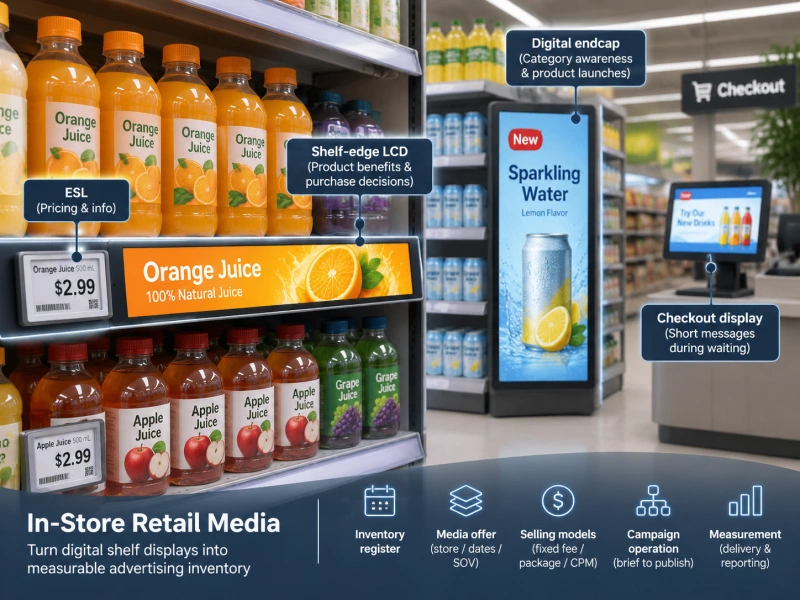
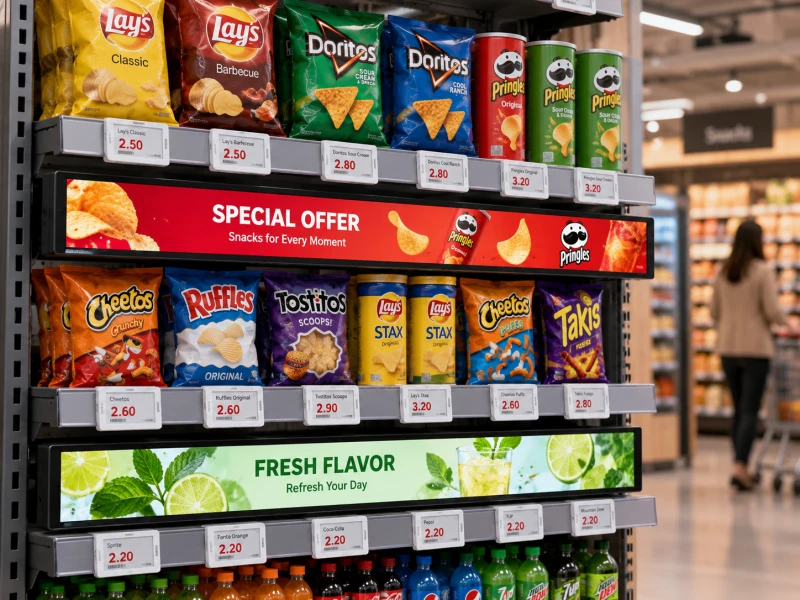
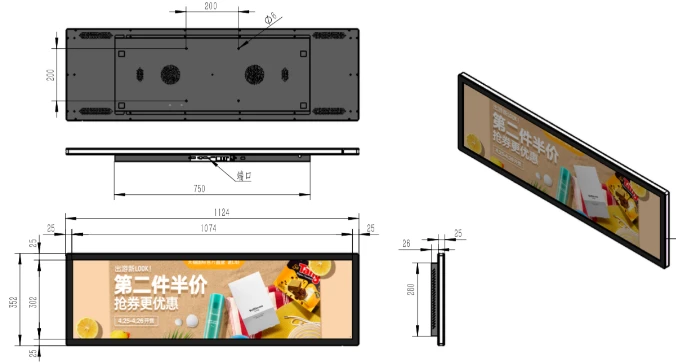
Stretched LCD screens eliminate this inefficiency. These ultra-wide displays, with aspect ratios ranging from 16:4 to 16:1, occupy the exact physical spaces that conventional screens cannot. A 23.1-inch bar-type display slides into a standard 600mm shelf edge. A 37-inch unit spans a freezer door frame. The technology exists not because engineers wanted to build unusual screens, but because retail environments demanded displays that conform to existing infrastructure rather than requiring infrastructure to change for them.

Why Shelf-Edge Displays Outperform Every Alternative
Traditional in-store marketing operates at a distance. Endcap displays catch attention from the aisle. Overhead signage provides wayfinding. Promotional posters decorate walls. All of these suffer from the same weakness: they are separated from the product by physical space and cognitive load.
A shelf-edge stretched LCD eliminates this gap entirely. The screen sits millimeters from the product it promotes. The customer's eye moves from display to merchandise without traversing any intervening space. There is no "find this product elsewhere" step. The call to action and the action itself occupy the same visual field.
Better conversion rates follow naturally from this setup. A pilot program at Carrefour's Lyon flagship store documented sales increases somewhere in the low-to-mid twenties percent range for promoted beverages when shelf-edge displays replaced traditional aisle-end promotions for the same products. The promotional budget remained identical-only the placement changed.
Static shelf talkers and paper price tags do not trigger this response. They exist in the visual environment but do not demand attention. A stretched LCD with animated content activates the peripheral motion detection system automatically. Customers turn their heads toward the movement without conscious decision.
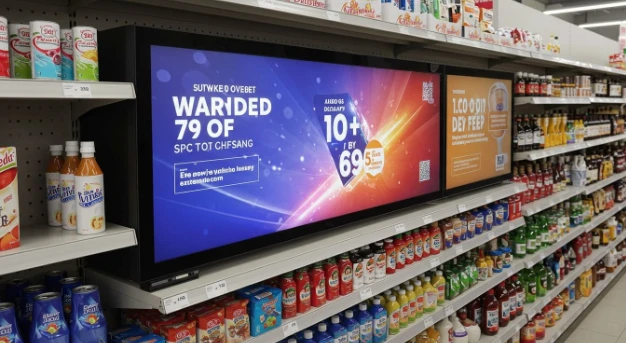
Research from the Ehrenberg-Bass Institute's retail attention study quantified this effect using eye-tracking across shopping trips in Australian supermarkets. Static shelf signage received brief glances averaging under half a second. Dynamic displays showing simple motion-not elaborate video, just animated price graphics-held attention several times longer. The study concluded that motion alone, independent of content quality, increased attention capture by a wide margin.

The involuntary nature of this attention capture is undervalued. The screen does not need to be beautiful or clever. It needs to move.
A paper promotional strip requires design, approval, printing, shipping, and manual installation across every store location. Changing the promotion means repeating this entire process. The marginal cost of each update is nearly as high as the original deployment. A networked stretched LCD display accepts new content in seconds. A headquarters marketing team can push updated pricing, swap promotional videos, or respond to competitor activity across an entire chain before lunch. The marginal cost of content updates approaches zero.
Promotional strategy changes as a result. Campaigns can be shorter, more targeted, and more responsive. A promotion that underperforms can be killed in hours rather than running out its print cycle. A competitor price cut can be matched the same day. Weather-triggered promotions become practical-pushing hot soup on cold days, ice cream when temperatures spike.
Kroger's deployment across hundreds of stores demonstrated this capability during an unexpected February cold snap in the Midwest. Within hours of weather service alerts, regional marketing teams pushed soup and hot beverage promotions to shelf-edge displays in affected stores. The campaign ran for 72 hours. Internal data showed meaningful lift in promoted categories compared to the same period in non-equipped stores-the exact numbers varied by region, but the pattern was consistent enough that weather-responsive promotion became standard practice.
Technical Specifications That Actually Matter
Panel Origin and Quality Tiers
The basics of LCD panel manufacturing-mother glass cutting, the distinction between native and cut panels, and major suppliers like BOE, AUO, and Innolux-are well documented elsewhere. What matters for procurement decisions is understanding what those basics mean in practice.
The real quality stratification happens at the distribution level, not the factory.
A Grade A panel from BOE's Hefei line might pass through three or four trading companies before reaching your supplier's warehouse in Shenzhen. Each intermediary has incentives to mix inventory. A shipment labeled "BOE Grade A" might contain mostly genuine Grade A panels, some Grade B that passed visual inspection, and a portion from a completely different manufacturer whose panels happen to fit the same mechanical specifications.
A regional grocery chain in the UK purchased several hundred budget displays from an Alibaba supplier. Within eight months, roughly a third had failed or degraded to unusable brightness levels. The total cost including removal, replacement, and lost promotional value exceeded what Grade A displays would have cost initially. Post-mortem analysis revealed panels from at least four different sources within the same shipment, with wildly inconsistent backlight specifications.
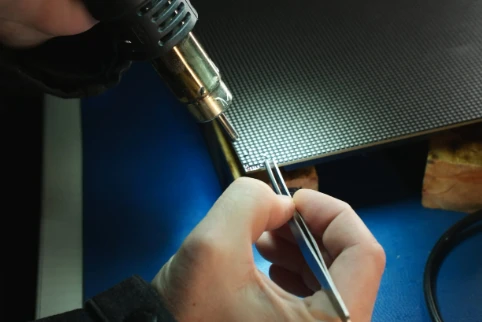
The procurement defense that actually works: require panel traceability documentation with original manufacturer lot numbers, and verify those lot numbers against the manufacturer's production records. BOE, AUO, and Innolux all maintain lot number verification systems for volume buyers. Suppliers who refuse this verification are telling you something important about their sourcing.
Another reality worth knowing: the "Grade A" designation itself has no universal standard. Each manufacturer defines their own grading criteria. BOE's Grade A allows a small number of dead pixels per panel. Innolux allows slightly more. Some Chinese manufacturers selling "Grade A" panels are using internal standards that would qualify as Grade C elsewhere. Always request the specific defect acceptance criteria in writing, not just the grade label.
Brightness and the Measurement Games Suppliers Play
The basic brightness requirements for retail environments-500-700 nits for standard indoor, 1000+ for high-ambient locations-are covered extensively in display selection guides. The specification itself is straightforward. The measurement methodology is where procurement gets tricky.
Every brightness spec on a datasheet is a lie by omission.
The number represents one of several possible measurements, and suppliers choose whichever method produces the highest figure.
Center-point measurement takes a reading at the exact center of the panel where brightness is highest. This can run significantly above the panel average-sometimes by a third or more. A display rated "700 nits" by center-point might average 500 nits across its surface. Nine-point average measures brightness at nine positions across the panel and averages them. This is the honest methodology. It's also the one that produces lower numbers, so fewer suppliers use it voluntarily. Peak transient brightness measures output during a brief pulse, not sustained operation. Some suppliers specify brightness this way without disclosure. A panel rated 700 nits peak might sustain only 550 nits in continuous operation.
Testing conducted by the Digital Signage Federation evaluated commercial shelf-edge displays from manufacturers including Philips, LG, and several Chinese OEMs. After 2,000 hours of continuous operation at 80% brightness, measured output ranged widely-some units retained over 90% of initial specification, while others dropped to around 70%. The units retaining the highest brightness were all from manufacturers using Samsung or LG-sourced LED packages rather than generic alternatives.
The only reliable approach: specify brightness as "sustained nine-point average after 500-hour burn-in" and require third-party verification from a testing lab you choose, not one the supplier recommends. Suppliers who won't agree to this are selling panels that won't meet their own specs under real-world conditions.
One more brightness trap that catches even experienced buyers: some suppliers quote brightness at maximum backlight setting, which no sane operator runs continuously because it halves the backlight lifespan. Ask for brightness at 70% backlight-that's the setting most commercial deployments actually use.
Thermal Management
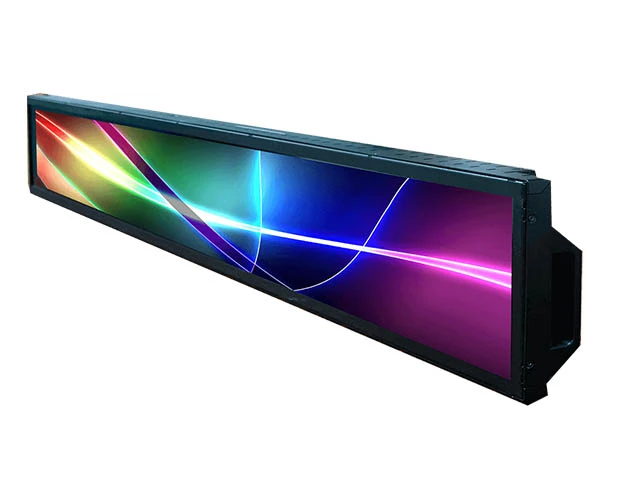
The elongated form factor of stretched displays creates a thermal engineering problem.
Heat generated by backlight LEDs and driver electronics must dissipate through a limited surface area. Poor thermal design manifests as accelerated LED degradation, yellowing of diffuser films, driver IC instability causing freezes and reboots, and shortened panel lifespan from liquid crystal damage.
Quality displays address thermal load through aluminum backplates that conduct heat away from components, strategic ventilation, and in some cases, active cooling. Budget displays often use plastic housings that trap heat.
A simple diagnostic: run the display at full brightness for two hours, then touch the back panel. Surface temperatures exceeding 50°C indicate thermal stress that will shorten operational life. Quality units maintain surface temperatures below 45°C under sustained operation.
Thermal management is where manufacturers cut corners first because customers can't see it. A plastic housing saves perhaps €8 per unit. It also reduces operational lifespan by something like 30-50% in high-ambient retail environments-though it varies considerably by installation conditions.
What the spec sheets never mention: thermal performance varies based on mounting orientation. A display tested horizontally on a bench might run 8-12°C cooler than the same unit mounted vertically on a shelf edge where convective airflow is restricted. Always test in actual mounting position, or add a generous safety margin to horizontal test results.
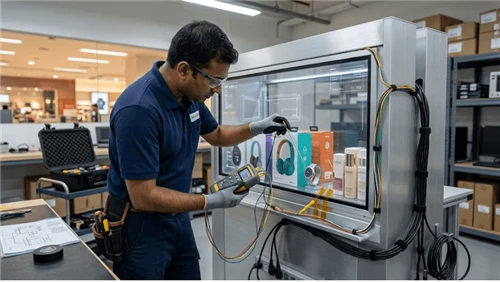
The freezer case problem is even worse. Displays mounted on freezer doors experience thermal cycling every time a customer opens the door-sudden temperature swings from -18°C to +22°C and back. Condensation forms inside the housing. Budget displays without proper sealing fail within months. One frozen foods distributor shared data showing much higher failure rates within the first year for non-rated displays mounted on freezer cases, compared to IP65-rated units designed for thermal cycling. The rated units cost 40% more. The total cost of ownership was substantially lower.
Processing Hardware
Most stretched displays integrate Android-based media players rather than requiring external hardware. The quality of this integrated computer determines playback capability, system stability, and longevity.
The processor hierarchy matters less than people think-what actually matters is RAM and storage quality.
RAM matters more than clock speed for long-term stability. A display with a fast processor but only 1GB of RAM will slow to a crawl after running for weeks as Android's memory management fragments. The content keeps playing, but response to network commands degrades, remote management becomes unreliable, and eventually the system needs a hard reboot. Specify 2GB minimum, 4GB for any deployment expected to run more than 12 months between maintenance cycles.
Many budget displays ship with Android 7 or 8 because the manufacturer never invested in board support packages for newer versions. These older Android versions have known security vulnerabilities and, more practically, lose compatibility with CMS platforms that update their apps to require newer Android APIs. A display shipping with Android 7 in 2024 might become incompatible with your chosen CMS within 18 months. Require Android 11 minimum, Android 12 or 13 preferred.
Storage specification matters too, but not in the way most buyers think. The flash storage in budget displays often uses low-endurance NAND that degrades with write cycles. A display that downloads and caches new content daily might exhaust its storage write capacity within 2-3 years, resulting in file corruption and playback failures. Commercial-grade displays use higher-endurance storage or implement wear-leveling algorithms that extend storage lifespan. Ask for the storage endurance rating in TBW (terabytes written) and calculate whether it will survive your expected content update frequency over the deployment lifetime.
The Economics of Shelf-Edge Display Deployment
A realistic 100-unit deployment of 23.1-inch shelf-edge displays carries the following cost structure:
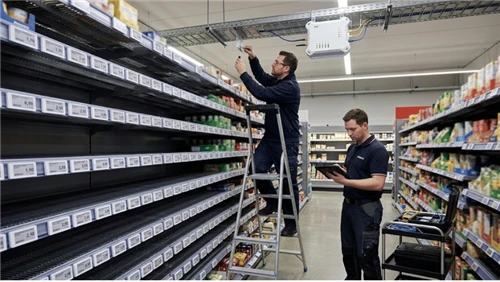
Hardware acquisition runs $200-400 per unit for commercial-grade displays with adequate brightness, thermal management, and integrated Android players. Budget alternatives exist at $120-180 but carry reliability and longevity risks that have already been described. Mounting infrastructure costs $25-75 per unit depending on shelf system compatibility. Standard supermarket shelving uses several incompatible edge profiles. Adapters or custom brackets are frequently required. Power infrastructure represents a bigger variable: $50-200 per unit depending on existing outlet availability. Shelf-edge displays require power every 600-1200mm along shelving runs. Few existing supermarkets have this density of outlets. Electrical work represents a significant hidden cost. Installation labor runs $40-100 per unit including mounting, power connection, network configuration, and content verification. Content management system subscriptions range from $3-15 per unit per month for cloud-based CMS platforms. Self-hosted alternatives reduce recurring cost but increase IT burden. Content production is highly variable. Basic templated content using product images and pricing may cost $2,000-5,000 initially. Custom video production for each product category can reach $20,000-50,000 annually.
Total first-year investment for 100 units: $45,000-90,000 depending on quality tier and installation complexity.
The costs that never appear in vendor quotes deserve special attention.
Planogram disruption is the big one-installing displays on active shelving requires either overnight work at premium labor rates or daytime installation that disrupts shopping and requires temporary product relocation. One grocery chain calculated that installation labor was only 40% of total installation cost; the remaining 60% was lost sales during installation periods, overtime for stocking staff to restore planograms, and shrinkage from products temporarily stored in back rooms.
Network infrastructure costs surprise almost everyone. Budget CMS platforms promise "works on any network," but retail Wi-Fi networks designed for inventory scanners and POS terminals typically lack the bandwidth and coverage for 100+ displays downloading content simultaneously. One regional chain discovered this during rollout when their nightly content push crashed the store network, taking down POS terminals. The network upgrade they hadn't budgeted for cost more than the displays themselves.
Return on Investment Reality
Industry vendors cite sales lift figures of 10-30% for products promoted on shelf-edge displays. These figures are not false, but they are misleading without context.
What drives measured lift: comparison against baseline periods without any promotion (not comparison against static signage), focus on high-impulse categories where any promotional attention drives incremental purchase, short measurement windows during initial novelty period, and cherry-picked high-performing SKUs rather than portfolio averages.
Realistic expectations: incremental sales lift for promoted products in the high single digits to mid-teens compared to static signage. Store-wide sales impact where even a couple percent improvement is meaningful success. Lift sustainability where you should expect noticeable decay from peak impact after six months as customer habituation develops.
McKinsey's retail technology assessment, based on data from grocery deployments across North America and Europe, found median Year 1 sales lift around 11% for promoted categories, declining somewhat in Year 2 as novelty effect diminished. However, retailers who refreshed content at least weekly maintained stronger lift through Year 2.
The profit math: a supermarket with $30,000 daily revenue achieving 2% incremental lift gains $600 daily or $219,000 annually. At 25% gross margin, this represents roughly $55,000 in incremental gross profit. Against a first-year deployment cost of $70,000, payback occurs in approximately 15 months.
This math works-but only with sustained content optimization. Displays showing stale content or irrelevant promotions rapidly lose effectiveness. The ongoing content investment is not optional.
Tesco's experience illustrates both the potential and the requirement. Their rollout across UK stores initially showed strong results-double-digit lift in promoted categories during Year 1. By mid-Year 2, lift had declined. An internal review attributed the decline to content update frequency dropping from twice weekly to once monthly as the novelty of the system faded and marketing teams redirected attention to other priorities. A renewed content commitment restored much of the initial performance.
The ROI calculations that vendor sales teams present always assume content costs are somehow external to the project. They're not. A more honest TCO model includes 0.5-1.0 FTE of ongoing content management labor, or $15,000-30,000 annually in agency retainer for content production. Factor this into payback calculations before signing.
Where Deployments Go Wrong
Not every deployment succeeds. The same failure patterns appear repeatedly:
Content starvation happens when organizations invest in hardware, then assign content responsibility to already-overloaded marketing staff. Updates become sporadic. Displays show the same loops for months. Customers ignore them entirely. System fragmentation occurs when different departments deploy competing display systems. Pricing on LCD contradicts pricing in POS system. Customer trust erodes. Staff spend time explaining discrepancies rather than selling. Wrong placement results from displays installed based on shelf availability rather than customer flow analysis. High-investment units face low-traffic areas. Premium impulse categories get no coverage. Maintenance neglect means failed units remain dark for weeks. Brightness-degraded panels display murky content. Network issues leave displays offline. The installation looks abandoned rather than premium.
One instructive failure involved a major US regional chain that installed over 2,000 shelf-edge displays across 60 stores over four months. Eighteen months later, fewer than half remained operational.
The causes: several hundred units failed mechanically because the procurement team had chosen a low-cost supplier, several hundred more were removed during planogram changes with no reinstallation plan, and the remainder were simply unplugged by store staff who found them "annoying" when content became repetitive. The post-mortem conclusion: "The organization bought a technology. It did not buy an operational capability."
One failure mode that rarely gets discussed: supplier disappearance. The stretched LCD market includes dozens of small Chinese manufacturers who enter the market, sell aggressively for a few years, and then either pivot to other products or simply close. Warranty claims become uncollectible. Spare parts vanish. Software updates stop. A medium-sized deployment from 2021 found itself orphaned in 2023 when the supplier simply stopped responding to communications. The displays worked, but when units failed, no replacements were available that matched the form factor and mounting system. The entire deployment had to be replaced at full cost within three years of initial installation.
Installation Architecture
Power Distribution Models
The power infrastructure decision shapes deployment cost and operational flexibility more than most buyers realize.
Distributed AC power gives each display dedicated 110/220V AC power. This requires outlet density that few retail spaces provide. Electrical contractor work represents major cost. However, this approach offers maximum reliability-each unit operates independently. Centralized DC power uses a power supply cabinet to deliver low-voltage DC to multiple displays via cable runs. Fewer outlets needed, easier future adds and moves, but you're introducing single points of failure-one power supply failure darkens multiple units. Power over Ethernet (PoE) uses network switches to provide power alongside data through Ethernet cabling. No separate power infrastructure needed, but limited to lower-power displays (under 25W) and may require injectors or PoE++ switches for adequate wattage.
For new construction or major renovation, distributed AC power during build-out provides the cleanest long-term solution. For retrofit into existing spaces, centralized DC or PoE reduces installation disruption.
The electrical code issue that catches retrofit projects: most retail spaces were built with electrical capacity calculated for lighting, refrigeration, and POS systems. Adding 100+ displays drawing 15-25W each might seem trivial-2.5kW total-but the existing panel may lack spare breaker positions, and the branch circuits serving shelf areas may already be at capacity. One chain discovered during installation that their shelf-level outlets were on the same circuits as refrigeration case lighting, and adding display loads was tripping breakers. The "minor electrical work" in their project budget became a full panel upgrade.
For anyone planning PoE deployment: standard PoE (802.3af) delivers only 15.4W, which is insufficient for any display with adequate brightness. PoE+ (802.3at) provides 30W, which covers most 23-inch units. Larger displays or units with higher brightness require PoE++ (802.3bt) at 60-100W. The switch infrastructure for PoE++ costs roughly 3x what basic PoE switches cost. Budget accordingly.
Network Architecture
Displays require network connectivity for content updates and health monitoring.
Ethernet (wired) is most reliable with highest bandwidth but requires cable runs to each display location. Preferred for permanent installations where cables can be concealed within shelving infrastructure. Wi-Fi has lower installation cost with no per-display cabling but is subject to RF interference from metal shelving, refrigeration equipment, and competing wireless systems. Requires robust AP deployment with specific attention to shelf-level coverage. Cellular (4G/5G) means each display contains its own modem with zero local network infrastructure required. Highest per-unit ongoing cost due to data plans but valuable for isolated displays or locations without reliable local connectivity.
Enterprise deployments should mandate Ethernet for primary shelf runs with Wi-Fi backup. Cellular serves edge cases only.
The Wi-Fi problem in practice is worse than the technical documentation suggests. Supermarket environments include an extraordinary amount of RF interference: refrigeration compressors generating electrical noise, metal shelving acting as signal barriers and reflectors, fluorescent lighting ballasts, wireless inventory scanners, customer smartphones, and often competing Wi-Fi from neighboring tenants. A display that works perfectly during off-hours testing may lose connectivity during peak shopping hours when the RF environment changes completely.
One deployment team learned this the hard way: their displays tested perfectly during installation, which happened overnight. During business hours, packet loss exceeded 40% on displays in the frozen foods section, where refrigeration equipment noise was highest. The content push that took five minutes overnight was taking over an hour during the day, which meant displays were showing stale content throughout peak shopping periods. The fix required hardwired Ethernet to the worst-affected locations.
Content Management System Requirements
The CMS platform determines operational capability. Requirements that should not be compromised:
Hierarchical scheduling so content can deploy at chain, region, store, zone, and individual display levels. A national promotion with regional pricing variations and store-specific inventory callouts requires this granularity. External data integration so price changes in the POS system flow to displays without manual intervention. Inventory data should suppress promotion of out-of-stock items. Weather feeds can trigger contextual content. API-first architecture enables this integration. Proof-of-play reporting so every content playback logs with timestamp and display identifier. This data supports vendor negotiations and internal optimization. Remote diagnostics providing dashboard visibility into display online status, playback errors, temperature readings, and brightness levels, with automated alerting when units go offline or exhibit anomalies. Template-based content creation so non-designers can produce acceptable content using pre-built templates that incorporate brand guidelines. Reliance on professional creative for every content update creates fatal bottlenecks.
CMS contract structures deserve more scrutiny than most buyers give them. Per-device licensing makes sense for small deployments but scales poorly. Enterprise licensing with device caps creates upgrade pressure at awkward times. Some platforms charge separately for API access, proof-of-play reporting, or advanced scheduling features that should be baseline functionality. One national chain signed a CMS contract based on per-device pricing that seemed competitive, only to discover that the "standard" tier lacked API access for POS integration-a feature they needed. The tier that included API access cost 3x more per device.
The integration promise that almost never delivers as advertised: "real-time POS price sync." In practice, POS systems export pricing on schedules ranging from every 15 minutes to once daily. The CMS can only display what it receives. True real-time would require direct database connections that IT security teams rightfully refuse to approve. Set expectations for "same business day" price accuracy, not "instant" accuracy.
Evaluating Suppliers
Vertical integration matters: suppliers controlling panel selection, driver board manufacturing, and final assembly can enforce quality standards throughout. Pure assemblers of third-party components have limited quality influence. Burn-in testing should be standard: every display should undergo extended powered operation before shipment. Twenty-four to forty-eight hour burn-in reveals infant mortality failures before field deployment. Request burn-in certification. Temperature cycling separates quality manufacturers from the rest: exposure to environmental stress testing-thermal cycling, humidity exposure-verifies resilience. Request test documentation. Component traceability is essential: suppliers should identify panel source, driver IC manufacturer, and power supply provider. Reluctance to disclose suggests variable sourcing that may include substandard components.
Regional spare parts inventory determines whether warranty means anything. Verify parts availability in-country before committing to volume purchases. Firmware update history reveals commitment level. Request the firmware changelog for the past two years. Active development indicates committed support. No updates suggest end-of-life or abandonment. Integration support distinguishes enterprise-ready suppliers: API documentation, technical integration assistance, and responsive engineering escalation matter. Reference customers provide reality checks. Request contact information for existing deployments of similar scale. Speak directly with operators about reliability experience and support responsiveness.
When evaluating suppliers, particularly those based in China where most stretched LCD manufacturing occurs, independent verification matters. SGS and Bureau Veritas both offer factory audit and product certification services specific to digital signage.
The factory visit trap that catches buyers who think they're being diligent: the factory toured may not be the factory that makes the order. Trading companies routinely arrange tours of high-quality facilities they've partnered with for demonstration purposes, then place actual orders with lower-cost facilities once contracts are signed. The countermeasure is specifying manufacturing facility in the contract with audit rights, and conducting unannounced audits during production runs-not just pre-contract visits.
Implementation
Deploy 10-20 units in a single high-traffic store first. Concentrate on one or two product categories. Objective is not scale but learning. Success metrics for pilot: hardware reliability under 5% failure rate over pilot period, content workflow where updates execute within one business day of request, and sales impact showing measurable lift in promoted SKUs compared to control period. Exit criteria: document hardware performance, operational process requirements, and preliminary ROI indicators before proceeding.

Then extend to 5-10 stores. Standardize installation specifications. Formalize content production workflow. Integrate with existing promotion planning calendar. Establish internal or contracted content production capability. Complete CMS integration with pricing and inventory systems. Train store operations staff on basic troubleshooting. Develop maintenance procedures and spare parts inventory.
Deploy across remaining store fleet. Shift focus from installation to optimization. A/B testing of content approaches by category. Placement optimization based on traffic pattern analysis. Content performance analytics informing creative development. Vendor consolidation and contract renegotiation based on volume.
The pilot design mistake that dooms many programs: running the pilot with a dedicated project team and heroic effort, then expecting BAU operations to replicate those results at scale. The pilot should explicitly use only resources that will be available during rollout. If the pilot requires the marketing director to personally approve every content update, the rollout will fail when that attention is no longer available. Pilot for scalable process, not just technology validation.
Stretched LCD displays for supermarket shelf edges are no longer experimental technology. The hardware is mature. The economics are proven in enough deployments that the patterns are clear. The operational requirements are understood.
The displays will function. Whether they perform is an organizational choice.
If you're evaluating stretched LCD displays for shelf-edge, freezer-door, or checkout deployment, talk to our team. We manufacture the full range-from 28-inch single-face units to 49-inch double-sided bar displays-with Grade A panel traceability, 48-hour burn-in testing, and aluminum thermal management as standard.
Q: What is a stretched LCD display and how is it different from a regular screen?
A: A stretched LCD is an ultra-wide display with non-standard aspect ratios (16:4 to 16:1) designed to fit spaces where regular 16:9 screens physically cannot-shelf edges, freezer door frames, gondola headers. The panel is either natively cut to this ratio from mother glass or trimmed from a larger panel. Functionally, it runs the same content as any digital signage screen, but its form factor lets it sit millimeters from the product at the point of purchase instead of on a wall across the aisle.
Q: How much do shelf-edge LCD displays cost per unit?
A: Commercial-grade bar-type LCD displays run $200–$400 per unit for sizes between 23″ and 37″ with adequate brightness (500+ nits sustained), aluminum thermal management, and an integrated Android media player. Budget alternatives exist at $120–$180 but carry significantly higher failure rates-some deployments have seen a third of budget units fail within eight months. The display itself is only part of cost; budget $25–$75 per unit for mounting, $50–$200 for power infrastructure, and $3–$15/month for CMS licensing.
Q: Do shelf-edge digital displays actually increase sales?
A: Yes, but the numbers are lower than vendor marketing suggests. Realistic incremental sales lift runs high single digits to mid-teens percent for promoted products compared to static signage-not the 30% figures in brochures. McKinsey data from grocery deployments across North America and Europe found median Year 1 lift of around 11% for promoted categories. The catch: lift decays if content goes stale. Retailers who refresh content at least weekly sustain stronger performance; those who let displays loop the same videos for months see diminishing returns.
Q: What brightness level do I need for supermarket shelf-edge displays?
A: 500–700 nits sustained nine-point average for standard indoor aisles. 1,000+ nits for locations with direct overhead lighting or window-adjacent shelving. The critical detail: demand the brightness spec measured as "sustained nine-point average," not center-point or peak transient-those inflated methods can overstate real-world brightness by 30% or more. Also ask for brightness at 70% backlight, since that's what commercial deployments actually run to avoid halving backlight lifespan.
Q: Can stretched LCD screens work on freezer doors?
A: They can, but only if the unit is built for it. Freezer-door mounting subjects displays to thermal cycling-swinging from -18°C to +22°C every time a customer opens the door-plus condensation forming inside the housing. Non-rated displays fail within months. IP65-rated units designed for thermal cycling cost roughly 40% more, but one frozen-foods distributor found their total cost of ownership was substantially lower because they avoided the cycle of mass failures, removal, and replacement that plagued cheaper units.
Q: How do I power shelf-edge displays across an entire store?
A: Three options. Distributed AC (dedicated 110/220V outlets per display) is the most reliable but requires expensive electrical work since few stores have outlet density at shelf level. Centralized DC (power supply cabinet feeding low-voltage cable runs) is cheaper to install but creates single points of failure. PoE (Power over Ethernet) eliminates separate power infrastructure but only works for lower-wattage units-standard PoE delivers just 15.4W, which is insufficient; you'll need PoE+ (30W) for most 23″ displays and PoE++ (60–100W) for larger or brighter units. For retrofits, centralized DC or PoE usually offers the best cost-to-disruption ratio.
Q: What size stretched bar display fits a standard supermarket shelf?
A: A standard supermarket gondola shelf section is 600mm (about 24″) or 900mm (about 36″) wide. A 23–28″ bar-type display fits a 600mm shelf edge. A 35–37″ unit spans a 900mm section or a freezer door frame. For long continuous runs like beverage aisles, 49″ double-sided displays or connected multi-screen configurations cover wider spans. Confirm your shelf edge profile before ordering-gondola brands use incompatible edge rails, so you may need custom brackets.
Q: Should I choose a shelf-edge LCD display or an electronic shelf label?
A: They solve different problems. Electronic shelf labels (ESLs) are battery-powered e-ink tags that replace paper price tags-one per product, showing static pricing and barcode info, updated wirelessly. Shelf-edge LCD displays are powered screens showing video, animation, and promotional content along the shelf run-one display covers an entire product category. Most advanced retail deployments use both: ESLs for accurate per-product pricing, and stretched LCDs for promotional attention and impulse-driving content. They complement rather than compete.
Related reading: What Does POP Stand for in Marketing? | Framing Effect: Why the Same Product Sells Better With Different Words | Walmart's Historic Digital Shelf Label Rollout | How to Build Cashierless Stores