Assortment optimization is the discipline that addresses this gap. It connects what headquarters decides to what customers actually find on the shelf - through data, continuous learning, and store-level execution. This guide covers what it is, why most approaches fail, how to implement it, and how to measure results.
Assortment Optimization vs. Assortment Planning: What's the Difference?
These two terms are often used interchangeably. They describe fundamentally different processes.
| Dimension | Assortment Planning | Assortment Optimization |
|---|---|---|
| Nature | Static, periodic | Dynamic, continuous |
| Data inputs | Historical sales, category rules | Real-time signals + historical data |
| Decision frequency | Seasonal or annual reviews | Ongoing, often automated |
| Geographic granularity | Store clusters or banners | Individual store level |
| What it misses | In-store execution reality | Nothing, if done well |
Planning defines what your assortment should look like. Optimization ensures it actually performs - and keeps improving as conditions change.
The Three Layers Where Assortment Decisions Are Made and Lost
Most retailers invest heavily in the first layer. The largest performance gaps live in the other two.
Strategic Layer: What to Sell
This is where category-level decisions happen: which products earn shelf space, how private label balances against national brands, and what role each category plays in the overall store strategy. Decisions here are made at headquarters, driven by market data and competitive benchmarking, and change on long cycles.
The risk: aggregate data masks local variation. A product with acceptable national sales may be underperforming in 40% of stores and overperforming in another 30%. Averages hide the signal.
Tactical Layer: Where and How to Sell It
The tactical layer translates strategy into location-specific plans: store clustering, planogram design, and merchandising rules. This is where assortment becomes genuinely local - a high-density urban store has different space constraints, foot traffic patterns, and shopper missions than a suburban format.
The risk: decisions at this level still rely heavily on assumptions rather than actual store-level signals. Assortments may look well-localized on paper while remaining broadly misaligned in practice.
Operational Layer: What Actually Reaches the Customer
This is where assortment optimization succeeds or quietly fails. The operational layer reflects the physical reality customers encounter: which products are on shelf, whether planograms are executed correctly, whether promotions are visible, and whether stockouts are caught and resolved quickly.
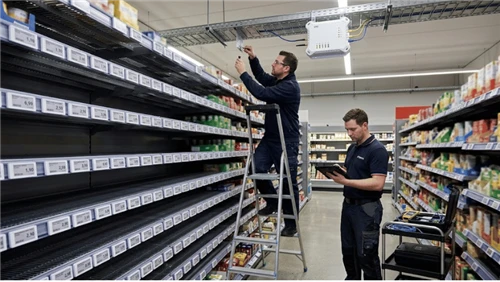
Without real-time visibility into store execution, every upstream decision is partially guesswork. Technologies like electronic shelf labels and IoT sensors are increasingly used to close this visibility gap - capturing shelf states automatically rather than relying on manual audits that happen too infrequently to be actionable.

Why Traditional Assortment Optimization Fails
Most assortment strategies are well-designed on paper. Here is where they break down in practice.
Failure Mode 1: Historical Data Optimizes for the Past
Sales history tells you what customers bought under the conditions that existed at the time - with the assortment that was available, at the prices that were set. It cannot tell you what customers wanted but could not find. In fast-moving categories, by the time a trend appears clearly in historical data, the window to act has often already passed.
Failure Mode 2: Centralized Decisions, Local Reality
When assortment decisions are made entirely at headquarters, store-level nuance gets averaged away. A product with mediocre national sales but strong performance in specific store types may be delisted. A standardized planogram gets deployed across stores with significantly different shelf dimensions and shopper demographics.
Failure Mode 3: Data Silos Produce Incomplete Decisions
Retail organizations generate data across multiple systems - point-of-sale, inventory, loyalty, e-commerce, and in-store sensors. Category managers work from one data set. Supply chain works from another. Store operations from a third. None of these views is complete, and decisions made from any single silo will create problems visible only in another.
Failure Mode 4: Planogram Compliance Is Lower Than Headquarters Thinks
A planogram only delivers value if it is executed correctly and consistently. In most retail networks, compliance rates vary significantly across stores - and headquarters typically does not know until it is measured. If you are evaluating a product's shelf performance based on sales data, but that product has been in the wrong bay position in 20% of your stores for three months, your performance data is unreliable. Understanding how frequently shelf data is refreshed is directly tied to the accuracy of these measurements.
Failure Mode 5: Omnichannel Signals Go Unread
Online customer behavior is a rich source of assortment intelligence that most physical retailers ignore. Zero-results searches on your e-commerce platform show you exactly what customers are looking for that you do not carry. High-browse, low-purchase patterns reveal demand that may require in-store evaluation before conversion. A customer who searches for a product online, finds it unavailable, and leaves generates no data in the in-store system - but that absence of data is itself a signal, if you build the process to capture it. The starting point is connecting your online search and browse data to your category planning workflow, even informally.

How AI Improves Assortment Decisions
Manual assortment management across hundreds of stores and tens of thousands of SKUs has reached the limits of what spreadsheets and periodic reviews can support. AI contributes in specific, measurable ways.
Store-level demand forecasting. Traditional forecasting operates at banner or cluster level. Machine learning models can generate forecasts at the individual store and SKU level, accounting for local factors - neighborhood demographics, nearby competition, seasonal micro-trends - that broader models average away. This granularity is what makes localized assortment decisions defensible rather than assumed.
SKU rationalization. Not every product earns its space. AI models can identify which SKUs are consuming shelf real estate and inventory capital without proportionate returns - accounting for margin contribution, substitution effects, and basket impact. The critical distinction is between slow-movers that serve a loyal niche and slow-movers that simply underperform. AI can distinguish between the two at a scale that manual analysis cannot.
Dynamic pricing and promotion alignment. Assortment decisions do not exist in isolation from pricing. AI-driven dynamic pricing can align promotional activity with assortment performance in real time - reducing the mismatch between what was planned and what customers actually respond to at shelf level.
Execution monitoring. Computer vision and sensor data can identify planogram deviations without requiring full manual audits. Advances in shelf label technology have made automated shelf-state monitoring increasingly accessible for mid-size retailers, not just large chains.
A Five-Step Framework for Implementation
Most retailers know assortment optimization matters. Fewer have a clear starting point. This framework is designed to be usable at any scale.
Step 1: Audit Your Current Assortment
Before optimizing anything, establish an honest baseline. What is your current stockout rate by category and by store? Which SKUs are generating the bottom decile of sales per square foot? Where are the largest gaps between planned assortment and actual shelf availability? If you cannot answer these questions with reliable data, that is itself the most important finding - and the signal to invest in visibility before investing in optimization tools. A structured baseline ROI calculation can help quantify where the highest-impact gaps are before committing to any approach.
Step 2: Define Your Store Clusters
Not all stores should carry the same assortment, but a completely unique assortment for every store is operationally unmanageable. Store clustering bridges these extremes by grouping locations with meaningfully similar demand profiles. Effective clustering is built on actual purchase behavior - basket composition, category velocity, shopper mission patterns - not on assumed demographics. Most retailers operate with four to eight clusters, depending on network size and format diversity. The right number is the one where each cluster genuinely behaves differently enough to warrant a distinct product template.
Step 3: Integrate Your Data Sources
Assortment optimization is only as good as the data that feeds it. At minimum, you need SKU-level sales data by store with at least 12 months of history, current inventory levels, and some measure of shelf availability. The question of how shelf data is captured - whether through manual reports, ESL systems, or IoT sensors - directly affects data freshness and reliability. Understanding the connectivity options for shelf data capture is a practical early decision. Perfect data integration is not a prerequisite for starting - but you need to understand your data's gaps and latency before trusting its output.
Step 4: Set Optimization Rules and Guardrails
AI models and optimization algorithms need constraints. Not every decision should be automated. Define clearly which decisions can run automatically - such as replenishment triggers for high-velocity SKUs - and which require human review, such as delisting a product from a cluster. Guardrails also protect against errors that automated systems make when data is incomplete. A common example: an algorithm recommends removing a product because its sales are low, when the actual cause is persistent stockouts that the sales data does not distinguish from low demand. Price and availability display errors are a related operational failure mode worth understanding before automation is introduced.
Step 5: Measure, Learn, and Iterate
Assortment optimization is a continuous process, not a one-time project. Establish a regular review rhythm - quarterly at minimum for strategic decisions, monthly for tactical adjustments. Build structured feedback loops between central category teams and store-level performance data. Treat each planning cycle as an experiment: form a hypothesis, implement a change, measure the outcome, use that learning in the next cycle. The organizations that extract the most value from this process are not those with the most sophisticated tools. They are those that have built the habit of learning from data consistently.
Six KPIs for Measuring Assortment Optimization
| KPI | What It Measures | Direction | How to Track |
|---|---|---|---|
| Stockout Rate | % of time a SKU is unavailable during store hours | ↓ Lower | POS gaps + automated stockout detection via shelf sensors |
| Sell-Through Rate | % of inventory sold before replenishment or markdown | ↑ Higher | Units sold ÷ units received, tracked by SKU and store |
| SKU Productivity | Revenue or margin per unit of shelf space | ↑ Higher | Category revenue ÷ shelf footage, benchmarked against cluster average |
| Planogram Compliance Rate | % of stores executing the planogram correctly | ↑ Higher | Manual audits or automated shelf image analysis; ESL deployment improves measurability |
| Category Margin Contribution | Gross margin generated relative to space allocated | ↑ Higher | Category P&L tracked against planogram allocation by cluster |
| Cluster Demand Alignment | Variance between planned assortment and actual category sell-through at cluster level | ↓ Lower variance | Compare sell-through rate across clusters; high variance signals localization gaps |
Track all six metrics at store level, not just in aggregate. Network-level averages frequently hide the stores where problems are most acute - and where the largest optimization opportunities exist.
Assortment Optimization Across Online and Physical Channels
For retailers operating across physical and digital channels, assortment decisions cannot be managed in isolation. The retail environment has changed: customers move between channels fluidly, and the data from each channel can inform decisions in the other.
Online as an assortment signal. Zero-results searches on your e-commerce platform are a direct indicator of assortment gaps - customers telling you exactly what they want that you do not carry. High-browse, low-purchase patterns may indicate products that customers want to evaluate in person before buying, which has implications for in-store ranging. According to McKinsey research, over 70% of consumers now expect personalized experiences - an expectation that applies to product availability as much as to communications.
Unified vs. differentiated assortment. Whether your online and in-store assortments should align depends on your store format and customer behavior. A unified assortment simplifies operations and produces cleaner demand data, but forces physical stores to carry the complexity of an online catalogue that most formats cannot accommodate. A differentiated approach - where physical stores carry a curated, high-velocity core while the online channel handles the long tail - works well when the two channels serve genuinely different shopping missions. The decision framework is simple: if customers regularly search online and convert in-store, alignment matters. If online and in-store shoppers are largely distinct audiences, differentiation may be more efficient.
Where to start. The most practical entry point is connecting your e-commerce zero-results search data to your category planning review. No new technology is required - a monthly export of failed search queries reviewed by category managers can surface assortment gaps that in-store sales data will never reveal. Pairing this with improved shelf-level data capture in physical stores creates a closed loop between online signals and in-store execution.
What This Looks Like in Practice
The following scenarios illustrate how assortment optimization principles apply across retail formats. These are illustrative examples, not specific company case studies.
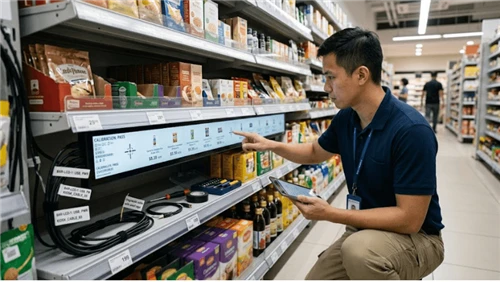
Grocery: local demand masking in aggregate data. A regional grocery chain plans assortments using aggregate category data. Ethnic food categories - strong performers in specific neighborhoods - are consistently underrepresented because their sales are diluted when rolled up to the banner level. A cluster-based approach built on actual basket composition reveals that what looked like low category demand in certain store groups was instead a structural data aggregation problem. Adjusting those stores' templates to reflect local purchase behavior closes the gap. The enabling factor is not new technology - it is disaggregating demand data by store rather than by banner. Better visibility through tools like electronic shelf labels in grocery stores supports the ongoing measurement of whether those adjusted assortments are actually being executed.
Fashion: long-tail SKU management. A specialty apparel retailer carries several thousand active SKUs per season. A productivity review reveals that a significant portion of the range generates a disproportionately small share of revenue while consuming planning, inventory, and replenishment resources. The analysis separates two groups of underperformers: SKUs with no identifiable loyal customer base and negative space-to-margin contribution, and SKUs with low overall volume but high repeat purchase rates among a specific buyer segment. The first group is phased out. The second is retained with adjusted space allocation. The result is a tighter range that is easier to execute and less likely to create decision fatigue at shelf level.
Convenience retail: execution speed as the differentiator. A small-format convenience chain operates in locations where every square foot is high-stakes and the cost of a stockout is magnified by low inventory buffers. The limiting factor is not the assortment plan - it is the time between a stockout occurring and a store associate responding to it. Reducing that gap through automated shelf monitoring, rather than relying on scheduled manual checks, has a direct and measurable impact on in-store availability for high-margin impulse categories.
Frequently Asked Questions
What is assortment optimization in retail?
Assortment optimization is the process of continuously selecting and refining the product mix offered in each store to maximize sales, margin, and customer satisfaction. Unlike one-time assortment planning, it integrates real-time data and ongoing performance reviews to keep the product selection aligned with actual demand.
What is the difference between assortment planning and assortment optimization?
Assortment planning is a periodic, centralized process - typically seasonal or annual - that defines which products to carry based on historical data. Assortment optimization is continuous. It incorporates real-time signals and store-level performance data to adapt the assortment as conditions change. Planning sets the initial direction; optimization keeps it calibrated.
How does AI improve assortment optimization?
AI enables store-level demand forecasting that goes beyond cluster averages, identifies underperforming SKUs while accounting for substitution effects, generates planogram recommendations based on current sales velocity, and processes real-time signals - weather, local events, competitor activity - that manual planning cycles cannot incorporate in time to act on.
What are the most common reasons assortment optimization fails?
The five most common failure modes: over-reliance on historical data that cannot capture current demand; centralized decision-making that misses local variation; siloed data systems that produce an incomplete picture; planogram compliance lower than headquarters assumes; and failure to incorporate online demand signals that reveal gaps invisible in in-store sales data alone.
What KPIs should I track for assortment optimization?
The most useful metrics are stockout rate, sell-through rate, SKU productivity (revenue or margin per unit of shelf space), planogram compliance rate, category margin contribution, and cluster demand alignment (variance between planned assortment and actual sell-through at cluster level). Track all of these at store level, not just in aggregate.
How long does implementation take?
A baseline audit and cluster-based optimization framework can typically be developed within a few months using existing data. More sophisticated AI-driven continuous optimization requires a stronger data foundation and may take 12 to 18 months to fully operationalize. Starting with the audit almost always reveals quick wins available before any new technology is needed.
Can smaller retailers benefit from assortment optimization?
Yes. The principles apply regardless of scale - understanding which products earn their space, tracking stockout frequency, and building feedback loops between sales data and product decisions are meaningful for any size operation. Smaller retailers may not need enterprise AI platforms; free or low-cost analytics tools can support useful optimization based on the data they already have. Choosing the right shelf label solution is one practical starting point for improving data capture without significant infrastructure investment.
What data do I need to start?
At minimum: SKU-level sales data by store with at least 12 months of history, current inventory levels, and some measure of shelf availability - even manual stockout reports. From this foundation, you can run a meaningful audit, identify your highest-impact opportunities, and build a data improvement roadmap. Perfect data is not a prerequisite. Useful optimization is possible with imperfect data, as long as you understand and account for its gaps.
Where to Start
Assortment optimization delivers the most value when it operates as a continuous loop - analyze performance, adjust the product mix, execute in-store, measure results, and repeat. The retailers who build this capability most effectively are not necessarily those who invest first in the most advanced tools. They are those who start with honest data about where their current assortment is failing, and build the organizational habits to act on that data consistently.
If you are starting from scratch, four actions are immediately actionable: run a stockout and SKU productivity audit using data you already have; review your store cluster definitions against actual purchase behavior rather than assumed demographics; connect your e-commerce zero-results search data to your category planning workflow; and define which assortment decisions should be automated versus reviewed by a human before execution.
Each of these can be done before any new technology is procured - and each will produce clearer visibility into where technology investment would actually move the needle.