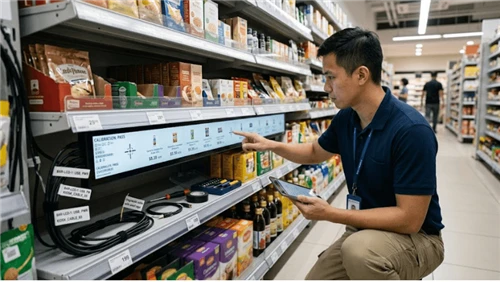
That gap between what a system records and what a shopper can actually buy is the on-shelf availability problem. According to IHL Group research, out-of-stocks cost global retailers over $1.2 trillion in lost sales each year. Most of that loss is preventable - but only once you understand where the failure actually starts.

What Is On-Shelf Availability?
On-shelf availability (OSA) measures the proportion of products that are physically present, correctly placed, and purchasable on the selling floor at a given moment - not what is logged in a warehouse management system, not what is sitting in an unopened carton in the backroom.
ECR Community defines OSA as the availability of a product "in the place the shopper expects it and at the time they want to purchase it." Both location and timing count. A product pushed to the back of a shelf or placed in the wrong bay may be physically present but functionally unavailable.
The OSA Rate Formula
OSA Rate (%) = (SKUs physically available on shelf ÷ Total planned SKUs) × 100
Example: A store plans 2,000 active SKUs. An audit confirms 1,860 are shoppable on the selling floor. OSA = 93%. That 7% gap is visible to every customer who walks the aisle. Your replenishment system may have no idea it exists.
What Is a Good OSA Rate?
Most grocery and FMCG retailers target 95% or above. Below 90% points to systemic failures in replenishment, inventory accuracy, or store execution. Even 95% means 1 in 20 expected products is unavailable at any audit. Target by velocity:
| Category | Suggested Target |
|---|---|
| High-velocity essentials (dairy, beverages) | 97%+ |
| Mid-velocity branded products | 94–96% |
| Seasonal or slow-moving SKUs | 90–93% |
| Promotional items during active campaigns | Daily monitoring |
OSA vs. Out-of-Stock vs. In-Stock Rate
| Term | What it measures | Stock location counted |
|---|---|---|
| On-Shelf Availability | Products shoppers can pick up | Selling floor only |
| Out-of-Stock Rate | Zero inventory anywhere in store | Nowhere in the store |
| In-Stock Rate | Any inventory present | Shelf and backroom combined |
A product can be "in stock" with 30 units in the backroom while the shelf is empty. In-stock rate hides this. OSA does not.
The Phantom Inventory Problem
Phantom inventory occurs when your WMS records a product as available, but the physical item is missing from the shelf. Because the system believes stock exists, no replenishment order fires. The shelf stays empty. No stockout event is logged.
Common causes: theft without a system transaction, receiving errors, mishandled returns marked as restocked, and checkout scan errors that fail to decrement inventory correctly.
There is no system-based fix. Physical verification - through regular cycle counts, RFID tracking, or shelf monitoring technology - is required. The necessary starting point is accepting that your WMS count and your actual shelf state are two different numbers.
Five Root Causes of Poor On-Shelf Availability
Choosing a solution before diagnosing the root cause is where most OSA improvement programs stall.
1. Phantom inventory. The WMS says stock exists; the shelf is empty; the reorder trigger never fires. Accumulates silently across hundreds of SKUs in high-volume stores.
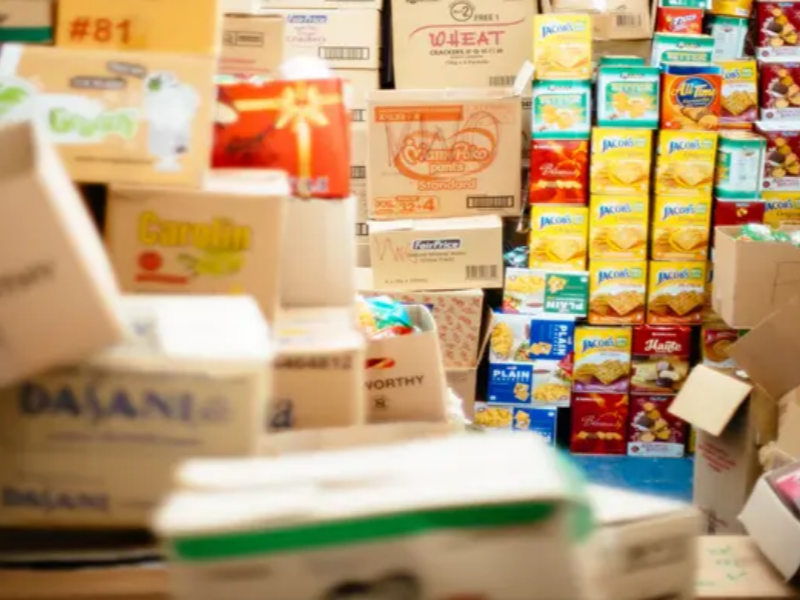
2. Backroom stock that never reaches the floor. Inventory is received, logged, and left in a carton in the stockroom. A process and accountability failure - not a supply problem - and one of the most underdiagnosed root causes in retail.
3. Inaccurate demand forecasting. Purchasing decisions built on flat historical averages consistently fail during promotions, seasonal peaks, and local events. The product sells faster than expected; the delivery arrives too late.
4. Planogram non-compliance. Products in the wrong location or incorrectly faced are unavailable to shoppers even when inventory counts are accurate. Most stores audit compliance too infrequently to catch this before customers do.
5. Supply chain disruptions. Supplier delays and lead time variability break the replenishment cycle before product reaches the store. Thin safety stock buffers amplify every upstream disruption.
A useful diagnostic: when you find an empty shelf, check whether the backroom has stock. If yes, the problem is execution - internal and operational. If nothing is in the building, the problem is supply or forecasting. These require different responses, different people, and different budgets.
How to Improve On-Shelf Availability
Step 1: Fix inventory data accuracy first
No replenishment tool, forecasting model, or shelf camera works well on bad data. Run rotating cycle counts by category rather than waiting for an annual stocktake - high-velocity lines need counting far more frequently. Train receiving staff to verify every item before logging receipt. Remove damaged goods from active inventory promptly; phantom inventory compounds fastest where write-offs are delayed.
Step 2: Make replenishment specific, not general
"Check the shelves" is not an instruction. Every SKU needs a defined minimum shelf quantity tied to its daily sales rate and lead time. When stock falls below that threshold, a named task is generated with the product, location, quantity, and deadline. Morning replenishment routines with named accountability per section close the backroom-to-floor gap faster than any other single change. Understanding how shelf management systems streamline replenishment workflows can help identify where automation fits into this process.
Step 3: Tighten supplier collaboration
- Share sales velocity and stock position data with key suppliers on a regular schedule
- Negotiate firm lead time commitments for highest-velocity SKUs
- Explore vendor-managed inventory (VMI) for stable, high-volume categories
- Build promotional pre-ordering protocols before demand spikes expose supply gaps
Step 4: Plan for demand peaks
Replenishment based on last week's average fails reliably during above-average periods. Build promotional calendars, seasonal patterns, and known local events into ordering decisions. When a specific SKU's actual velocity diverges from forecast for two or more consecutive weeks, treat it as a model problem - not a one-off to wait out.
Step 5: Make planogram compliance a number, not a standard
Shelf presentation is part of on-shelf availability. Audit compliance after every promotional reset and seasonal changeover - periods when shelf organization degrades fastest. Teams that see compliance data maintain it; teams told to "keep shelves tidy" tend not to.

Technology That Supports Better OSA
Technology amplifies good processes. Match the tool to the failure you have actually diagnosed.
Electronic Shelf Labels
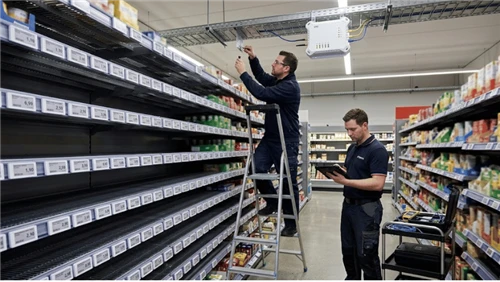
Electronic shelf labels replace paper tags with digitally updated shelf-edge displays. Connected to inventory systems, they trigger low-stock alerts when a product falls below a set threshold - linking the shelf directly to the task workflow. For retailers weighing a switch, reviewing the advantages and disadvantages of electronic shelf labels alongside a practical ESL vs. paper label comparison sets realistic expectations. Grocery store ESL deployments consistently show reductions in manual pricing labor alongside faster replenishment response.
For a financial assessment, the real costs of ESL deployment extend beyond hardware to infrastructure and ongoing maintenance. An ESL ROI calculator can model payback against labor savings and OSA improvement gains. Installation requirements vary by store format and existing network infrastructure.
RFID and Computer Vision
RFID delivers the strongest results in apparel retail, where size-color-style variants make phantom inventory and mislocation difficult to detect at scale. For high-volume grocery formats, the per-item tag cost is less compelling. Computer vision shelf monitoring systems flag gaps and misplaced products continuously, reducing the lag between an OSA event and corrective action from hours to minutes.
| If your main OSA failure is… | Most relevant technology |
|---|---|
| Phantom inventory or inaccurate records | RFID, cycle count automation |
| Shelf gaps not detected in time | Computer vision, shelf cameras |
| Slow or missing replenishment orders | Automated replenishment platforms |
| Pricing and labeling errors at shelf | Electronic shelf labels |
| Planogram non-compliance | Image-based compliance auditing |
Three Mistakes That Set OSA Programs Back
Trusting the WMS count without physical verification
Sixty units in the system does not mean sixty units are on the shelf, undamaged, correctly placed, and accessible to shoppers. WMS records reflect what was scanned - not the physical shelf state. A classic phantom inventory scenario: the system shows full stock while a section has been empty for three days. System counts are a starting point, not a substitute for physical confirmation.
Escalating upstream before checking the backroom
When shelves are empty, the reflex is to contact the buying team or supplier. But in many OSA failures, the stock is physically in the building - it just has not been moved to the floor. Before escalating, confirm whether execution is the constraint. The answer determines whether you need a supply chain conversation or a shift briefing. Confusing the two wastes time and creates friction in the wrong place.
Measuring OSA as a single store-wide number
A 94% store-level OSA rate can coexist with a category running at 67% and key SKUs below 60%. Aggregate metrics hide the performance variation that drives most customer complaints. Tracking OSA at the category and SKU level - reviewed by store and by week - turns the metric from a compliance figure into an operational tool.
Frequently Asked Questions
What is a good on-shelf availability rate?
Grocery and FMCG retailers typically target 95% or above for mainstream SKUs. Below 90% signals systemic problems requiring root cause diagnosis. The right target varies by category velocity - high-frequency essentials justify tighter thresholds than slow-moving specialty lines.
What causes poor on-shelf availability?
The most common causes are phantom inventory, slow backroom-to-shelf transfer, inaccurate demand forecasting, planogram non-compliance, and supply chain disruptions. Most stores face several simultaneously. The diagnostic question - does backroom stock exist when the shelf is empty? - should come before selecting any solution.
How do electronic shelf labels help with OSA?
ESLs eliminate manual pricing errors that create shelf confusion and enable low-stock alerts when integrated with inventory platforms. Dynamic pricing capabilities also let retailers manage demand more actively against stock conditions. For how ESL infrastructure connects with retail operations systems, this overview of electronic shelf label solutions covers the key components.
Can OSA be improved without advanced technology?
Yes. Accurate cycle counting, specific replenishment task assignments, and tracked planogram compliance are operational changes that cost little and often deliver immediate results. Technology accelerates good processes - it does not create them. Many stores achieve meaningful OSA improvement within weeks before any technology investment is made.
Where to Start
OSA improvement is a diagnostic exercise before it is a technology decision. Find where your inventory leaves the system and fails to reach the shelf. Once you know whether the problem is in data, processes, supplier relationships, or store execution, the right interventions - and their ROI - become considerably clearer.
If you are evaluating electronic shelf label solutions as part of a shelf performance program, or exploring why retailers are switching from paper labels to digital shelf displays, grounding that decision in a clear root cause diagnosis will make the investment significantly stronger.