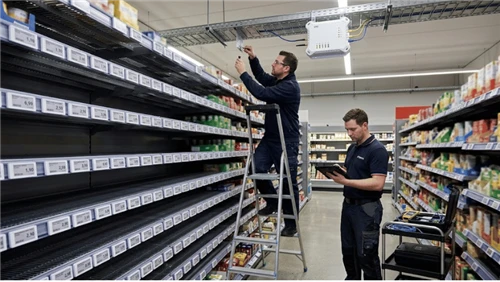
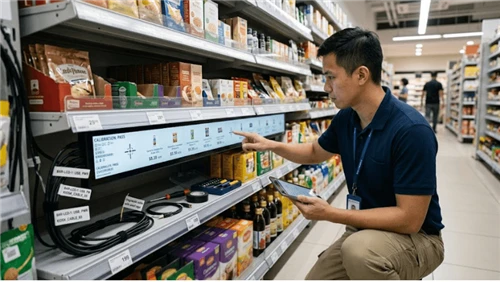
This gap between the shelf as it was planned and the shelf as it actually exists is one of the most measurable sources of lost revenue in grocery retail - and one of the least systematically tracked. If your operation manages more than a handful of locations and you have not audited planogram compliance in the past 90 days, the gap is almost certainly larger than you think. This guide explains where it comes from, what it costs, and how to close it in a way that scales.
It also covers on-shelf availability (OSA) - a closely related metric that measures whether the right product is in the right place at the right time. Planogram compliance is one of the primary drivers of OSA performance, and the two should be managed together.
What a Planogram Actually Does - and What a Realogram Is
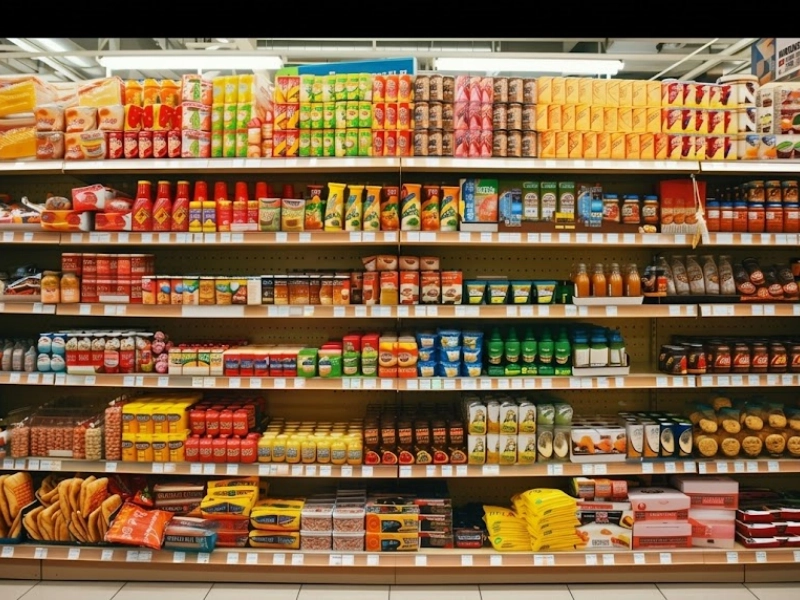
A planogram is a visual blueprint specifying which product goes on which shelf, at what height, in what facing count, and in what order relative to adjacent SKUs. It encodes decisions about eye-level priority, cross-merchandising logic, space-to-sales ratios, and - critically in grocery - the paid placement agreements that CPG brands negotiate with retail buyers. A planogram is not just a picture of a shelf. It is a revenue allocation document.
A realogram is a record of what the shelf actually looks like at a given moment. It can be captured through a manual photo audit, a mobile compliance app, an AI shelf camera, or a robotic scanning system. The comparison between the two is what generates a compliance score: the percentage of shelf positions, facing counts, and product placements that match the approved planogram.
The distinction matters because the gap between planogram and realogram is not random noise - it follows predictable patterns, which means it can be systematically addressed. Digital price tags and shelf labelling systems are increasingly part of how retailers create a traceable, auditable record of shelf state that bridges the two.
Why the Gap Opens: Four Root Causes Worth Understanding
Most compliance failures get blamed on "staff not following instructions." That framing is too simple to fix anything. The gap between planogram and realogram has four distinct causes, and each requires a different intervention.
1. Execution Errors During Shelf Resets
Planogram resets happen under real time pressure. A team resets a full grocery aisle within a narrow labor window, working from a schematic that may be six pages of annotations. The biggest compliance drift occurs in the 48–72 hours immediately following a reset, before habits adjust. A product goes in the wrong bay. A facing runs one short. An endcap display ends up with last season's promotional items because nobody checked the revision date on the instructions.
2. Supply Chain Substitutions
This is the most common root cause and the most frequently overlooked. When a product is out of stock, the shelf does not stay empty - a team member fills the gap with whatever is available. That substitution breaks the planogram silently. No deviation report is filed. No one is notified. The shelf looks full, which is why manual visual checks often miss it. For grocery categories with high replenishment velocity - chilled beverages, fresh produce adjacencies, private-label dairy - this happens daily. Good shelf labelling compliance practices help signal when a substitution has occurred, but only if the labelling system is integrated with planogram data.
3. Unauthorized Store-Level Adjustments
Store managers often believe, not always wrongly, that they understand their local shoppers better than a planogram designed at headquarters. So they adjust: pull a product forward, swap two SKUs because of a customer complaint, rearrange a section to accommodate a delivery. These changes are rarely documented. Across a chain of 50 stores, you may be running 30 unofficial shelf layouts simultaneously - which makes it impossible to know whether your category strategy is working or simply not getting a fair test.
4. Planogram Version Control Failures
Planograms are updated continuously - for seasonal promotions, new product introductions, vendor resets, category reviews. Each update has to reach every relevant store before the reset window opens. In practice, updated planograms often arrive late, arrive in the wrong format, or are simply not opened. Stores execute the reset on the previous version. The result is systematic non-compliance from day one, invisible until an audit catches it - often weeks later.
Compliance Challenges Specific to Grocery
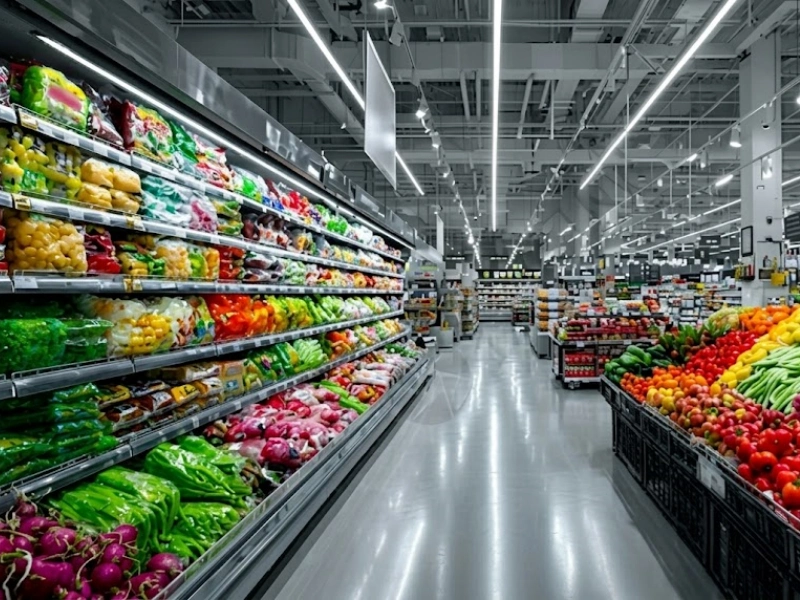
Planogram compliance is a challenge across retail formats, but grocery stores face structural complications that other sectors do not.
Chilled and fresh categories have the highest replenishment frequency and the shortest compliance windows. A planogram for the yogurt aisle may be disrupted and restored three times in a single day as deliveries arrive, sell through, and are replenished in whatever order stock arrives from the back room. Compliance snapshots taken at 9am look nothing like the shelf at 2pm.
Seasonal promotional resets in grocery are among the most complex compliance events in any retail format. A holiday confectionery reset might require reconfiguring 20 linear meters of shelf space within a 4-hour window, across 200 stores, in a single weekend. Version control failures and execution errors concentrate heavily in these events.
Endcap positions are simultaneously the most financially valuable shelf positions and the most frequently non-compliant. CPG brands pay significant premiums for endcap visibility. Research consistently shows these are also the first positions to be "borrowed" for whatever inventory needs a home when the planned product is unavailable. Learn more about how grocery stores are addressing these challenges with electronic shelf labels.
What the Gap Actually Costs
The compliance gap has measurable financial consequences for retailers and for CPG brands. According to industry analysis published by FieldPie, every 10% gap in planogram compliance corresponds to approximately 1% in lost category sales - and typical compliance rates across grocery retail hover between 60% and 70%. That arithmetic compounds across categories and locations.
A 2025 GlobalData study found that 33% of shoppers identify hard-to-find products as their top in-store frustration. Planogram non-compliance is a direct cause: when a product is in the wrong bay or missing from its planned position, shoppers either leave without buying or switch to a competing brand - sometimes permanently.
For CPG brands, the stakes are more direct. A brand that has negotiated eye-level placement across 400 stores is paying for shopper visibility it may not be receiving. When an endcap does not go up, a promotion that was funded at trade-agreement level delivers no return. Persistent non-compliance strains vendor relationships and can redirect co-op marketing investment toward channels with better execution accountability.
Before You Start: A 5-Question Compliance Health Check
Before investing in new tools or processes, get an honest baseline on where your operation stands:
- Do all stores currently execute the same version of each planogram, or is version control managed manually by email or PDF?
- When was the last time your team photographed a representative sample of shelves and compared the images against the current planogram?
- Do you have a defined process for what happens when a product is out of stock at reset time - or does the team make individual judgment calls?
- Can you produce a compliance rate (compliant facings ÷ total planned facings × 100) for any category, in any store, right now?
- After your last major seasonal reset, how long before you confirmed that all participating stores had executed correctly?
If the answers to three or more of these questions are "no" or "I'm not sure," your compliance gap is structural, not incidental. The fixes below address each of these points directly.
A Three-Stage Path to Closing the Gap
Stage 1 - Measure Before You Fix
The first step is establishing a real compliance rate, not an estimated one. Run a structured realogram audit: photograph each shelf section in a representative sample of stores - aim for at least 10% of locations if you have a large network, or every store if you have fewer than 20. Compare each image against the current approved planogram and count the deviations.
Calculate your baseline: (compliant facings ÷ total planned facings) × 100. Industry data from VisionGroup Retail places typical grocery compliance rates between 60% and 70%. A realistic improvement target is 85% or above. Knowing your starting number tells you which categories and locations to prioritize, and gives you a baseline against which to measure any process changes.
In parallel: audit your version control. Pull the planogram document actually in use on your store floors right now and compare it against the version in your planning system. If they do not match, that is your first fix - not technology, not additional labor.
Stage 2 - Systematize the Audit Process
Once you have a baseline, replace ad-hoc compliance checks with a consistent, role-defined workflow. Assign ownership: who captures shelf images (store associate, field rep, or category manager), who reviews them (regional supervisor or category team), and who is accountable for correction (store manager with a defined response window).
Run compliance audits within 48–72 hours of every planogram reset - the highest-drift window - and then on a regular cadence throughout the reset period. A mobile audit application standardizes image capture and routes photos to the right reviewer automatically, which removes the "I'll get to it" failure point. Category-level compliance rates should be a reported metric at every store review, not an informal impression.
Stage 3 - Scale with Real-Time Monitoring
Systematic mobile audits close the loop faster, but they still operate on a visit cadence. For high-value categories - particularly those with paid placement agreements - the cost of a compliance gap accumulating over days is higher than the cost of continuous monitoring.
AI shelf cameras mounted above or on shelving fixtures capture shelf state continuously and compare it against the approved planogram automatically. Deviations are flagged in real time, before lost sales accumulate. Research published in Scientific Reports demonstrates that computer vision systems deployed at scale - the study covered over 7,000 convenience stores - can detect shelf deviations and route correction tasks to store teams with high accuracy and without manual auditor involvement.
For grocery operations with electronic shelf labels in grocery stores, compliance monitoring can be integrated directly into the ESL infrastructure. Because each label is addressable and its position is recorded, the system knows when a label is in the wrong location or missing entirely - providing a continuous layer of location-level compliance data that does not require a camera to capture. Understanding how electronic shelf labels work helps clarify why this integration is particularly effective in high-SKU grocery environments.
Compliance data from any Stage 3 system should feed back into your planogram design process. If a particular category shows persistent drift in a specific store cluster, that is information: the planogram may not reflect that location's actual replenishment schedule, assortment availability, or physical shelf constraints. Dynamic shelf management enabled by connected label systems makes this feedback loop faster and more granular.
Choosing the Right Monitoring Approach
The right compliance monitoring method depends on your store count, category complexity, existing technology infrastructure, and how much compliance gap you can afford to carry between audits.
| Approach | Detection Speed | Best Fit | Key Constraint |
|---|---|---|---|
| Manual shelf audit | Days to weeks | Independent or small-format grocery | High labor cost per audit; inconsistent coverage across teams |
| Mobile compliance app | Hours to 1–2 days | Regional chains (10–50 stores) | Effectiveness depends entirely on staff adherence to capture protocol |
| Fixed AI shelf cameras | Real-time | High-SKU chains, paid placement monitoring | Installation cost and infrastructure; not all aisle formats accommodate fixed mounting |
| Robotic shelf patrol | Near real-time | Large-format stores, high-aisle-count environments | Operational complexity; patrol cadence gaps in highest-traffic hours |
| ESL-integrated monitoring | Real-time | Stores with existing ESL infrastructure | Requires ESL deployment to be in place; initial setup investment |
These approaches are not mutually exclusive. Many mid-size grocery chains run mobile audits for full-store coverage while deploying fixed cameras or shelf display technology in their highest-value categories. For operations evaluating the cost case, an ESL ROI calculator can help model the financial return of moving from manual audits to integrated shelf monitoring.
Frequently Asked Questions
What is the difference between a planogram and a realogram?
A planogram defines how a shelf should look - what goes where, in what quantity, in what order. A realogram is a record of how the shelf actually looks at a given moment. Planogram compliance measures how closely the realogram matches the planogram.
Why is planogram compliance harder to maintain in grocery than in other retail formats?
Grocery stores combine high SKU counts, frequent replenishment cycles, perishable product volatility, and complex vendor placement agreements. These factors create more opportunities for deviation than most retail formats, and less time to catch and correct them before the shelf turns over again.
How do you calculate planogram compliance rate?
Divide the number of shelf facings in their correct position with the correct facing count by the total number of planned facings in the planogram, then multiply by 100. A score of 85% or above is generally considered a strong operational baseline. Most grocery operations measure between 60% and 70% before implementing a systematic compliance program.
How does planogram compliance affect out-of-stock rates?
The two are directly linked. When a product goes out of stock and a substitute fills its position, the planogram deviation is recorded - but the original product's facing is effectively lost. Systematic OOS tracking and planogram compliance monitoring, when integrated, give operations teams early warning before a stock gap becomes a lost sale. Electronic shelf labels connected to inventory systems help close this loop in real time.
How often should grocery stores audit planogram compliance?
At minimum: within 48–72 hours of every planogram reset, when drift is highest. For categories with paid placement agreements or high OOS risk, weekly audits are a reasonable standard. For high-value positions monitored by AI cameras or ESL systems, the audit is continuous.
What happens to CPG vendor agreements when planograms are not followed?
CPG brands that have paid for specific positions - eye level, endcap, front-of-store - receive less shopper visibility than the trade agreement specifies. Persistent non-compliance reduces the return on trade investment, creates friction in vendor relationships, and in some cases constitutes a breach of the placement contract terms. Brands that track compliance across their retail network can identify which partners consistently execute and allocate trade investment accordingly.
Can electronic shelf labels replace manual planogram audits?
Not entirely, but they significantly reduce the need for them. ESL systems with planogram integration know which label belongs in which location and can flag when a label is moved, missing, or displaying the wrong product. This provides a continuous layer of position-level compliance monitoring that manual audits can only replicate at a point in time. Electronic shelf label solutions vary in how deeply they integrate with planogram and inventory systems - the degree of integration determines how much of the audit burden they can absorb. For a full comparison of ESL display technologies, ESL refresh rates and display performance is a useful reference point when evaluating hardware.
What is a realistic first step for a grocery operation with no current compliance process?
Run the Compliance Health Check questions above. Then photograph one aisle in three different stores and score each shelf section against your current planogram. Calculate the compliance rate. That number - however uncomfortable - is your starting point and the baseline against which every subsequent improvement will be measured.
The Gap Is Structural. So Is the Fix.
The planogram–realogram gap is not a discipline problem. It is the predictable result of operating a high-SKU, high-velocity retail environment without systematic tools for measuring execution. Version control failures, supply chain substitutions, and unauthorized local adjustments happen in every grocery chain - the difference between operations that manage the gap and those that don't is whether they have a process that catches deviation before it compounds.
If you are running more than 15 stores and cannot produce a current compliance rate for your top three categories, that is where to start. Measure first. The right technology - whether mobile audits, a shift to electronic shelf labels, or AI camera systems - follows from knowing what you are actually trying to fix. For operations evaluating the real cost of compliance infrastructure, a breakdown of ESL deployment costs is a practical starting point for the budget case.